
Project

Urban Flood Forecast Visualization Platform – Phase 1

A responsive web GIS dashboard integrating observed data, forecast-model output, animated weather-radar rainfall, storm-surge forecasts and flash-flood risk areas.
Client
Hydro-Informatics Institute (HII)
Year
2019–2020
Urban Flood Forecast Visualization Platform – Phase 1
  • Real-time situation maps, charts and historical search.
  • Python import routines, PostgreSQL 11, GeoServer WMS/WFS, Leaflet with time dimension.
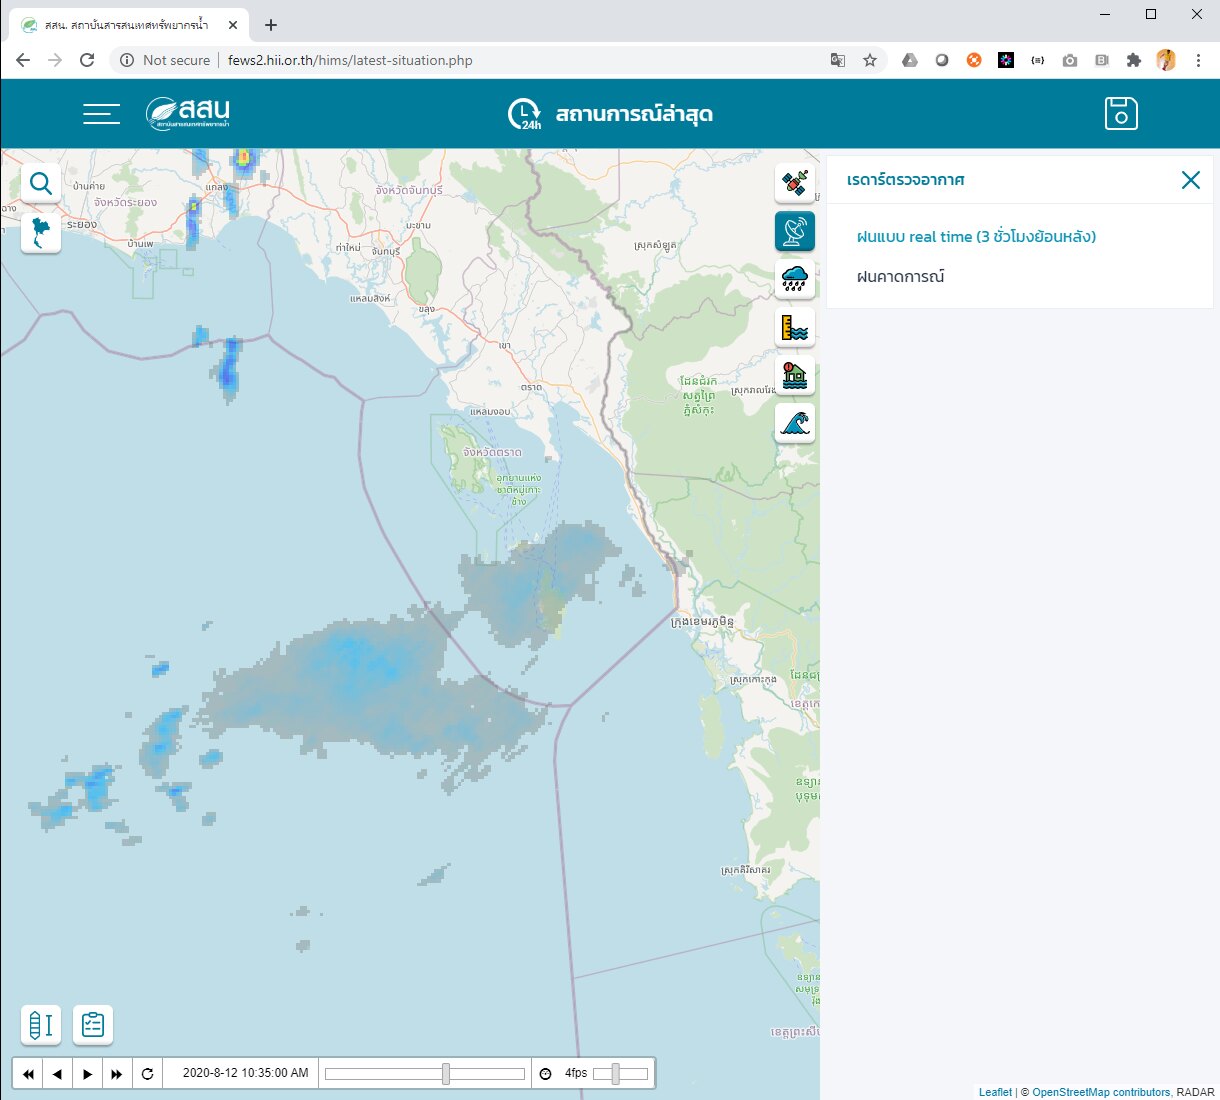
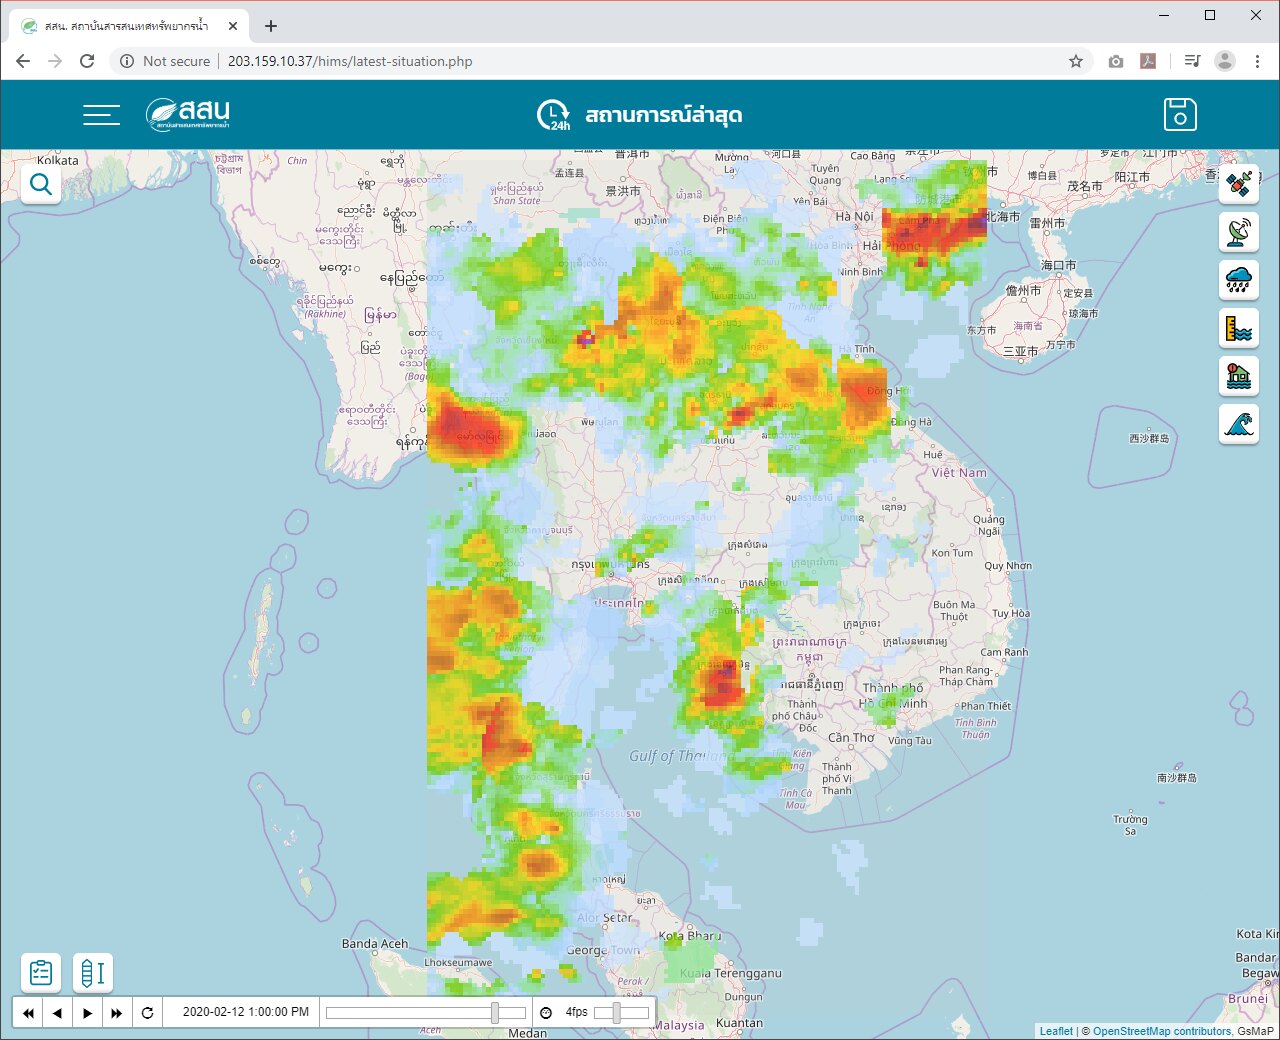
Weather-radar rainfall served through OGC WMS and shown on the situation map.
Animation controls: step or play radar and rainfall frames along a timeline at an adjustable frame rate.
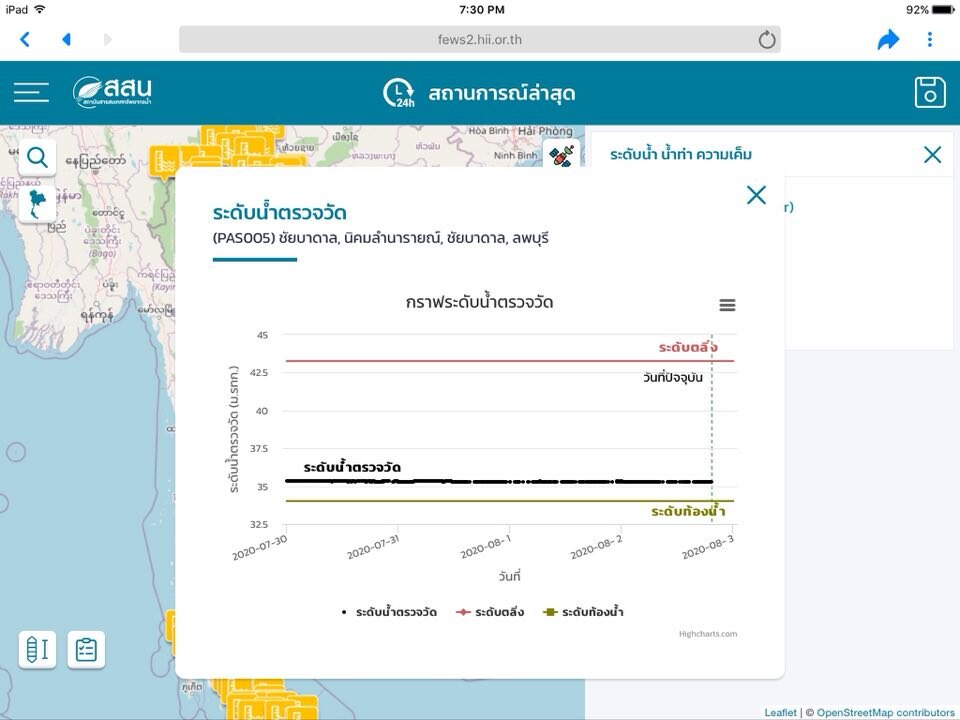
The same dashboard on a tablet, with observed water-level charts.
← All projects